The traceback viewer tool helps you to display and select information about Python tracebacks. The tool accepts traceback information copied and pasted into the tool using the paste button on the tool’s feature toolbar or received from another tool connected to the tool’s buffer facet.
Once a string containing traceback information is received, it is parsed and displayed in a table with one row for each traceback stack frame. Each table row contains the following columns:
Selecting any line in the traceback table assigns a FilePosition object describing the source code line being executed by the selected stack frame to the tool’s file_position facet, making it available to any connected tools. You can also drag the same FilePosition object to another tool or application using the drag (upward pointing arrow) icon on the tool’s feature toolbar.
The tool also intercepts output being sent to stderr, allowing it to analyze and display tracebacks occurring in the running application.
facets.extra.tools.traceback_viewer
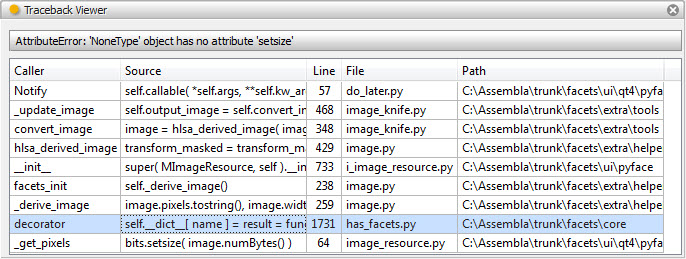
Shows the traceback viewer tool displaying information about a traceback that was copied and pasted from a command shell.


